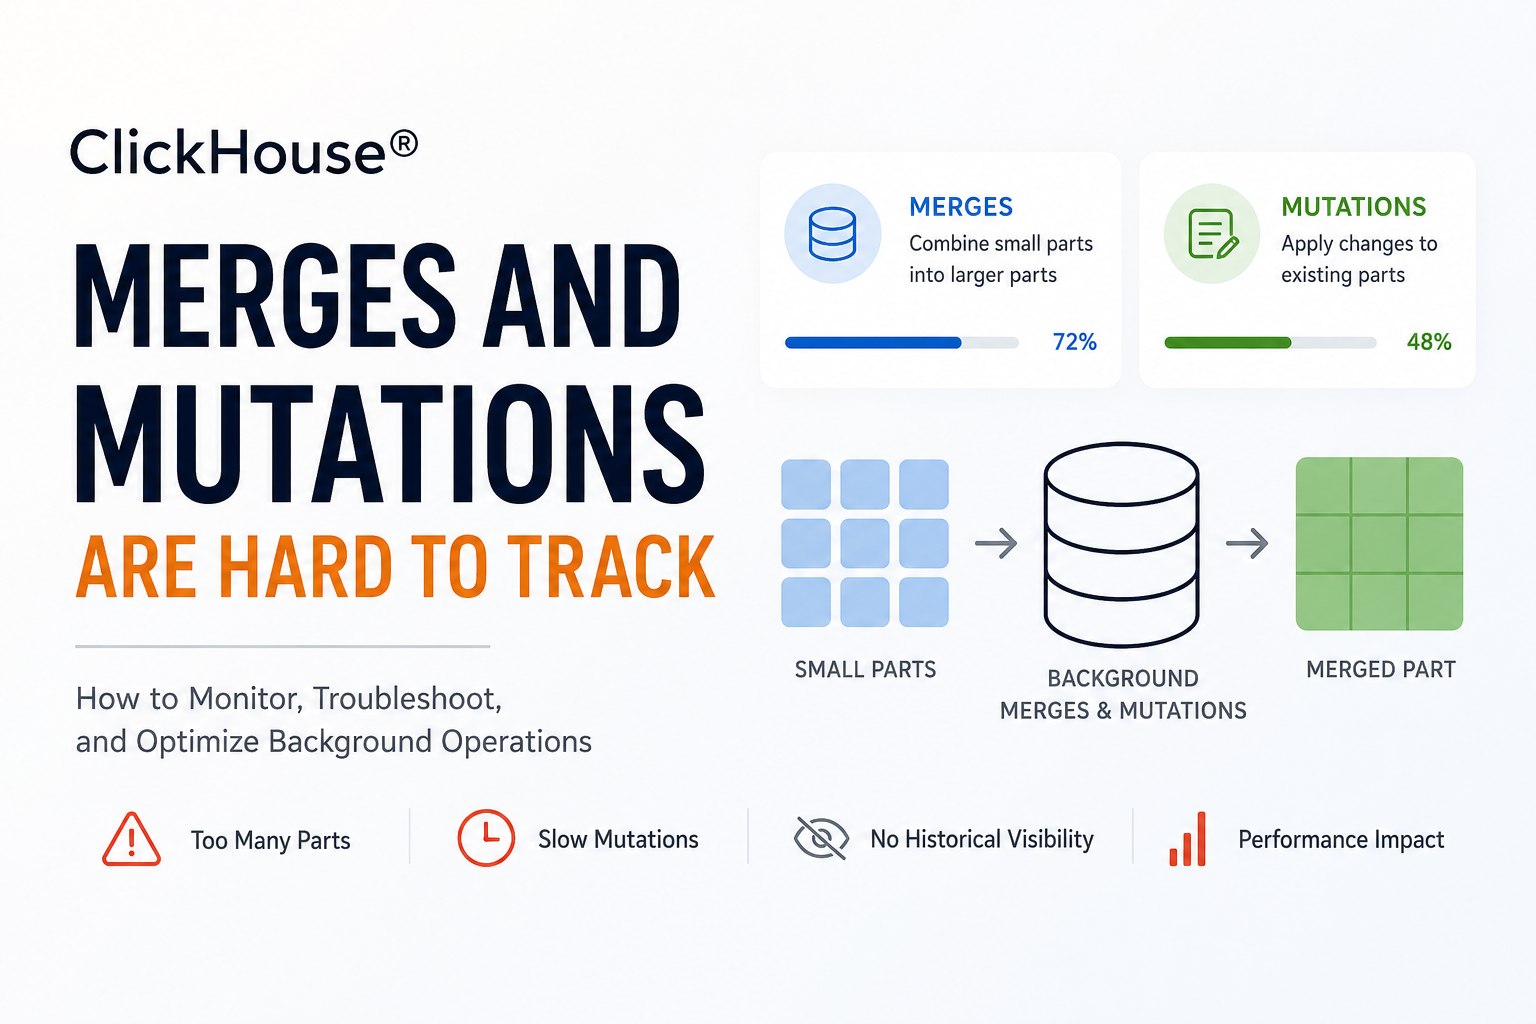
How to Monitor, Troubleshoot, and Optimize Background Operations
Introduction
One of the reasons ClickHouse® delivers exceptional analytical performance is its storage engine. Instead of updating data in place, ClickHouse continuously performs background merges and mutations to keep data organized and queries efficient.
While these operations happen automatically, they can sometimes become difficult to monitor. A growing number of table parts can lead to "Too many parts" errors, while long-running mutations may delay updates and consume significant system resources.
Unlike query execution, merges and mutations do not always provide clear visibility into their progress. Administrators often rely on manually checking system tables, making it difficult to identify bottlenecks before they impact production workloads.
In this article, you'll learn how merges and mutations work, why monitoring them matters, and how to troubleshoot common issues.
Understanding Background Merges
ClickHouse stores data in immutable parts.
Whenever new data is inserted, a new part is created. Over time, hundreds or even thousands of parts can accumulate.
To improve query performance and reduce storage overhead, ClickHouse automatically merges smaller parts into larger ones.
A typical merge process looks like this:
Insert Data
     │
     ▼
Part A   Part B   Part C
   │       │       │
   └───────┴───────┘
          ▼
     Background Merge
          ▼
      Larger Part
Benefits include:
- Fewer files on disk
- Faster query execution
- Better compression
- Lower metadata overhead
What Are Mutations?
A mutation modifies existing data.
Operations such as:
- UPDATE
- DELETE
- MATERIALIZE COLUMN
- MATERIALIZE INDEX
are executed as background mutations rather than immediate row updates.
For example:
ALTER TABLE events
DELETE WHERE event_date < '2024-01-01';
Instead of deleting rows instantly, ClickHouse schedules a mutation that rewrites affected parts in the background.
Large mutations can take considerable time depending on:
- Table size
- Number of parts
- Available CPU
- Disk throughput
Why Monitoring Merges and Mutations Matters
When background tasks fall behind, overall database performance can degrade.
Common symptoms include:
- "Too many parts" errors
- Slow inserts
- High disk usage
- Long-running ALTER operations
- Increased CPU utilization
- Delayed DELETE or UPDATE operations
These issues often appear gradually before becoming production incidents.
Monitoring Active Merges
ClickHouse exposes active merge operations through the system.merges table.
SELECT
    database,
    table,
    elapsed,
    progress,
    num_parts
FROM system.merges;
Example output:
| Database | Table | Progress | Elapsed |
|---|---|---|---|
| analytics | events | 0.72 | 35 sec |
| logs | access_logs | 0.41 | 18 sec |
Useful columns include:
progresselapsednum_partsbytes_read_uncompressedbytes_written_uncompressed
These values help determine whether merges are progressing normally.
Monitoring Mutations
Use system.mutations to inspect mutation status.
SELECT
    database,
    table,
    mutation_id,
    command,
    is_done,
    parts_to_do
FROM system.mutations;
Example:
| Mutation | Status | Parts Remaining |
|---|---|---|
| mutation_25.txt | Running | 48 |
| mutation_26.txt | Completed | 0 |
Important fields include:
is_doneparts_to_dolatest_failed_partlatest_fail_reason
These columns quickly reveal stalled or failed mutations.
Detecting Too Many Parts
Having thousands of small parts negatively affects performance.
Check part counts using:
SELECT
    database,
    table,
    count() AS parts
FROM system.parts
WHERE active
GROUP BY database, table
ORDER BY parts DESC;
If a table contains an unusually high number of parts, background merges may not be keeping up with incoming inserts.
Common causes include:
- Very small insert batches
- Heavy concurrent ingestion
- Slow storage
- Limited background threads
Viewing Merge Queue Activity
You can also monitor merge-related metrics through the system metrics tables.
Useful metrics include:
- Active merges
- Background pool utilization
- Pending merge tasks
- Mutation queue length
These metrics are valuable when building dashboards in monitoring tools like Grafana.
Common Reasons Merges Fall Behind
Several factors can slow background merges:
Small Insert Sizes
Frequent tiny inserts create excessive parts.
Instead of:
1 row
1 row
1 row
Prefer batching:
10,000 rowsLarger inserts significantly reduce merge pressure.
Heavy Disk I/O
Merges read and rewrite large amounts of data.
Slow disks become a bottleneck.
SSD or NVMe storage dramatically improves merge throughput.
Large Mutations
Executing large DELETE or UPDATE operations rewrites many data parts.
Instead of one massive mutation, consider processing data in smaller batches when possible.
Background Thread Saturation
ClickHouse uses background threads for merges.
If all workers remain busy, new merge tasks accumulate.
Monitoring thread utilization helps detect this condition early.
Best Practices
To keep merges and mutations healthy:
- Batch inserts instead of inserting individual rows.
- Monitor active part counts regularly.
- Watch long-running mutations.
- Use fast storage for production workloads.
- Avoid frequent large DELETE operations.
- Schedule heavy maintenance during off-peak hours.
- Build dashboards around system tables for continuous monitoring.
Example Monitoring Queries
Largest tables by part count:
SELECT
    table,
    count()
FROM system.parts
WHERE active
GROUP BY table
ORDER BY count() DESC;
Running merges:
SELECT *
FROM system.merges;
Pending mutations:
SELECT *
FROM system.mutations
WHERE is_done = 0;
Building Dashboards
Many production teams collect data from:
system.mergessystem.mutationssystem.partssystem.metricssystem.events
Visualizing these metrics helps identify merge backlogs before they impact users.
A simple dashboard can display:
- Active merges
- Pending mutations
- Part count per table
- Merge throughput
- Background thread utilization
This provides continuous visibility into ClickHouse background activity.
Conclusion
Background merges and mutations are essential to maintaining ClickHouse performance, but they often operate behind the scenes. Without proper monitoring, issues such as excessive part counts, stalled mutations, and merge backlogs can quietly grow until they affect ingestion and query performance.
By regularly inspecting system.merges, system.mutations, and system.parts, batching inserts efficiently, and monitoring background activity with dashboards, you can detect problems early and keep your ClickHouse cluster running smoothly.
Understanding these internal processes is a key step toward operating ClickHouse reliably at scale.