When a query runs in ClickHouse®, the database does far more than simply read data and return results.
Before execution begins, ClickHouse® analyzes the query, determines how data should be accessed, identifies optimization opportunities, and builds an execution pipeline designed to process the query efficiently.
Understanding this process is one of the most valuable skills for anyone working with ClickHouse®. It allows you to diagnose performance issues, validate optimization efforts, and better understand why certain queries perform differently from others.
In this article, we'll explore how ClickHouse® executes queries, what execution plans reveal, and how tools like EXPLAIN can help you understand what is happening behind the scenes.
Why Query Execution Plans Matter
Many engineers focus on the query itself:
SELECT
    country,
    count()
FROM events
GROUP BY country;
However, the SQL statement only describes what result should be returned.
The execution plan describes how ClickHouse® intends to produce that result.
Understanding execution plans helps answer questions such as:
- How much data is being read?
- Are filters being applied efficiently?
- Is data skipping working?
- Are projections being used?
- Is the query scanning unnecessary data?
- Where is most of the processing happening?
Without visibility into query execution, performance tuning becomes largely guesswork.
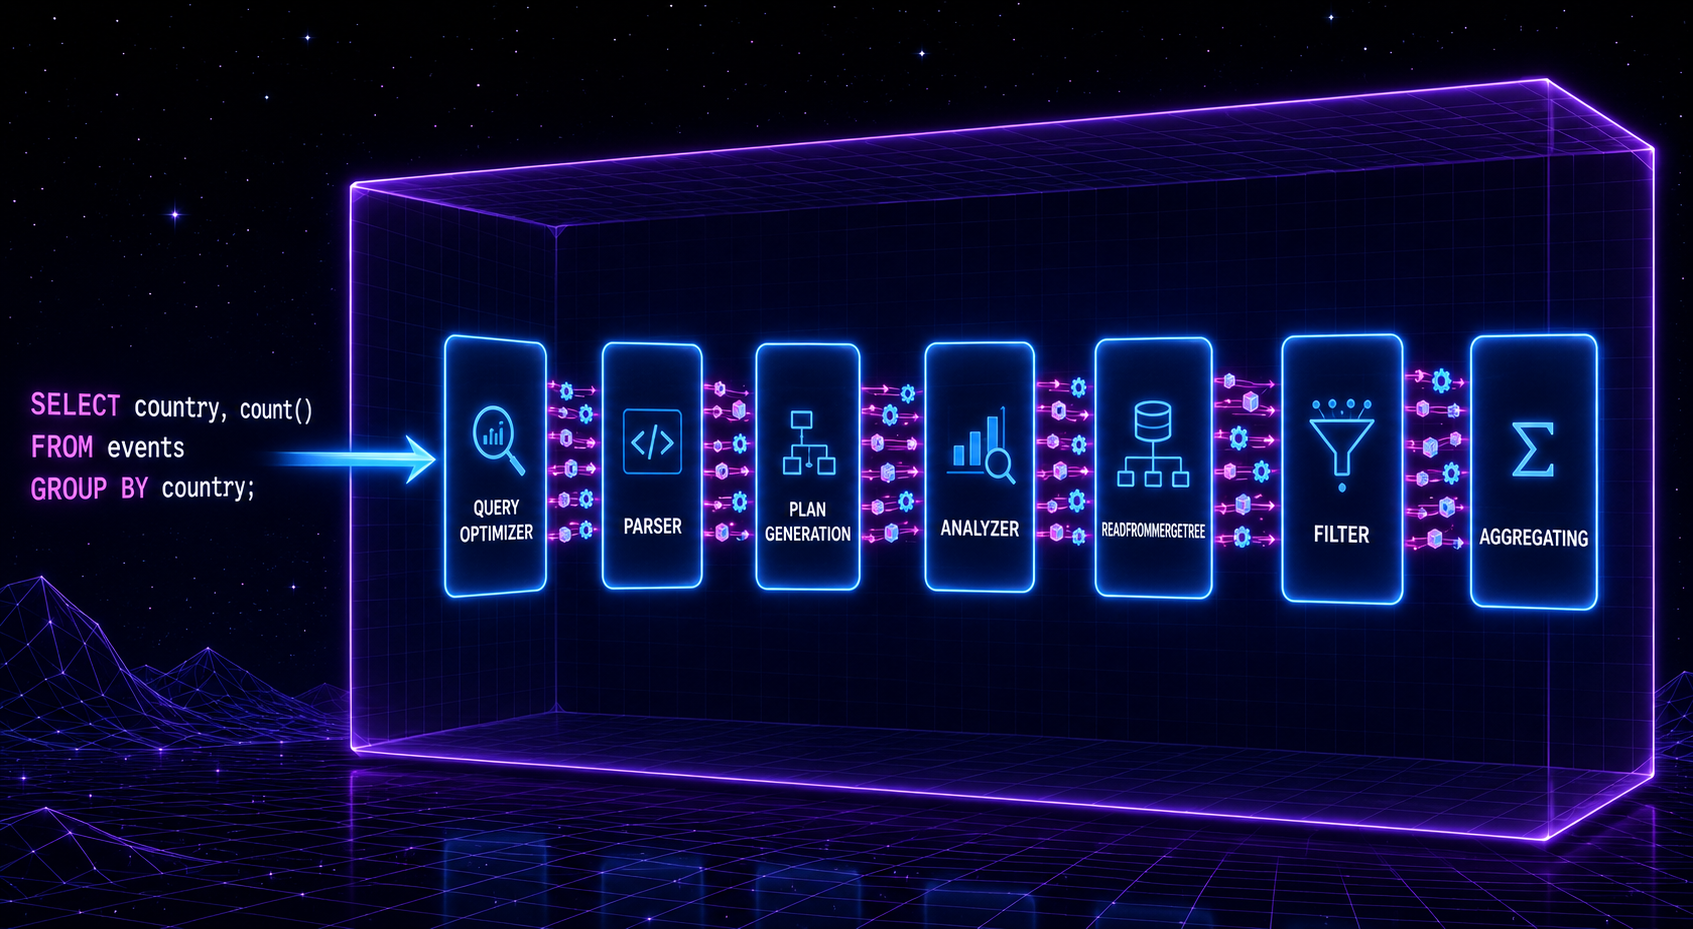
The Query Lifecycle
Every query typically passes through several stages:
- Parsing
- Analysis
- Optimization
- Plan Generation
- Pipeline Construction
- Execution
A simplified workflow looks like:
SQL Query
    ↓
Parser
    ↓
Analyzer
    ↓
Optimizer
    ↓
Query Plan
    ↓
Execution Pipeline
    ↓
Results
Understanding these stages makes execution plans easier to interpret.
Meet the EXPLAIN Statement
The primary tool for understanding query execution is EXPLAIN.
Example:
EXPLAIN
SELECT
    country,
    count()
FROM events
GROUP BY country;
Rather than executing the query, ClickHouse® returns information about how the query will be processed.
Different EXPLAIN modes provide different levels of detail.
EXPLAIN AST
AST stands for Abstract Syntax Tree.
Example:
EXPLAIN AST
SELECT *
FROM events
WHERE country = 'US';
This view shows how ClickHouse® interprets the query structure after parsing.
It is useful for understanding how expressions, filters, and functions are represented internally.
EXPLAIN PLAN
One of the most commonly used modes is:
EXPLAIN PLAN
SELECT *
FROM events
WHERE country = 'US';
This displays the logical execution plan.
Typical output may contain operators such as:
- ReadFromMergeTree
- Filter
- Expression
- Aggregating
- Sorting
This helps visualize the major processing steps involved in executing the query.
EXPLAIN PIPELINE
ClickHouse® executes queries using a highly parallel pipeline.
Example:
EXPLAIN PIPELINE
SELECT
    country,
    count()
FROM events
GROUP BY country;
This reveals how work is distributed across execution threads.
The output often includes:
- Parallel reads
- Transform stages
- Aggregation operators
- Merge operations
Pipeline analysis is particularly useful when investigating CPU utilization and parallelism.
Understanding ReadFromMergeTree
A common operator you'll encounter is:
ReadFromMergeTreeThis indicates that ClickHouse® is reading data from a MergeTree-family table.
When analyzing execution plans, this operator often reveals:
- Number of parts accessed
- Granules read
- Filtering effectiveness
- Data skipping opportunities
A healthy execution plan typically reads significantly less data than the table's total size.
Evaluating Filtering Efficiency
Consider:
SELECT *
FROM events
WHERE user_id = 12345;
A good execution plan may indicate that only a small number of granules are being accessed.
This often means:
- Sorting keys are effective.
- Primary indexes are helping.
- Data skipping is working.
If most granules are still being scanned, the table design may need improvement.
Understanding Aggregation Stages
Aggregation-heavy queries commonly produce operators such as:
AggregatingExample:
SELECT
    country,
    count()
FROM events
GROUP BY country;
Execution plans help reveal where aggregation occurs and how intermediate results are combined.
This becomes especially important in distributed environments where aggregation may occur on multiple shards before final merging.
Query Plans in Distributed Clusters
When querying Distributed tables, execution plans become even more valuable.
Example:
SELECT
    country,
    count()
FROM events_distributed
GROUP BY country;
The plan may show:
- Remote reads
- Distributed aggregation
- Intermediate result merging
- Network communication stages
These insights help identify expensive cross-shard operations.
Identifying Performance Problems
Execution plans can often reveal common issues.
Excessive Data Reads
Symptoms:
Large number of granules scannedPossible causes:
- Poor sorting keys
- Ineffective filtering
- Missing projections
Unnecessary Sorting
Symptoms:
Sorting operator appears unexpectedlyPossible causes:
- ORDER BY requirements
- Query design issues
Expensive Distributed Operations
Symptoms:
Large remote processing stagesPossible causes:
- Excessive cross-shard data movement
- Poor sharding strategy
Combining EXPLAIN with Query Logs
Execution plans provide one perspective.
Query logs provide another.
Useful system tables include:
system.query_log
system.query_thread_log
Together, execution plans and query logs provide a comprehensive view of query behavior.
Execution plans show what ClickHouse® intends to do.
Query logs show what actually happened.
Best Practices
When analyzing ClickHouse® query execution plans:
- Start with EXPLAIN PLAN.
- Use EXPLAIN PIPELINE for deeper analysis.
- Review filtering effectiveness.
- Check granules and parts being scanned.
- Look for unexpected sorting operations.
- Analyze distributed query behavior.
- Compare plans before and after optimizations.
- Validate assumptions using query logs.
Final Thoughts
Query execution plans provide a window into how ClickHouse® processes data internally.
While writing SQL is important, understanding how ClickHouse® interprets and executes that SQL is often the key to unlocking better performance.
By learning how to use EXPLAIN, analyze execution pipelines, and interpret operators such as ReadFromMergeTree and Aggregating, you can move beyond guesswork and make informed optimization decisions.
Whether you're troubleshooting a slow query, evaluating a new table design, or tuning a production cluster, query execution plans are one of the most powerful tools available in ClickHouse®.
Exploring ClickHouse® for Your Analytics?
At Quantrail Data, we help teams run ClickHouse® reliably for real-time analytics – from Kubernetes deployments and migrations to performance tuning in production.
We see these challenges firsthand while supporting demanding analytics workloads. In one recent engagement, a customer achieved near bare-metal performance with ClickHouse® in production – a story we’ve shared here: Success Story: Quantrail Bare-Metal ClickHouse® Deployment
If you’re evaluating ClickHouse® or trying to get more out of an existing setup, we’re happy to share practical lessons from real-world deployments.
Contact
References
[ClickHouse® Documentation – EXPLAIN Statement] (https://clickhouse.com/docs/sql-reference/statements/explain) [ClickHouse® Documentation – Query Analyzer] (https://clickhouse.com/docs/guides/developer/understanding-query-execution-with-the-analyzer) [ClickHouse® Documentation – EXPLAIN PIPELINE] (https://clickhouse.com/docs/sql-reference/statements/explain#explain-pipeline)