Modern analytics platforms require more than just a fast database. Organizations need a complete workflow that enables data ingestion, storage, transformation, and visualization while maintaining performance as data volumes grow.
A common approach is to combine ClickHouse® for analytical processing with Apache Superset for dashboarding and visualization. ClickHouse® provides high-performance query execution and aggregation capabilities, while Superset offers an intuitive interface for exploring data and building interactive dashboards.
In this article, we'll walk through a simple analytics stack built using ClickHouse® and Apache Superset, examine how the components work together, and explore how data modeling decisions can influence dashboard performance.
Why Build Dashboards with ClickHouse®?
Business Intelligence (BI) dashboards are often the primary way organizations consume analytical data. While SQL queries can provide answers to specific questions, dashboards enable:
- Continuous monitoring of business metrics
- Self-service analytics
- Interactive data exploration
- Faster decision-making
- Reusable datasets and visualizations
The database powering these dashboards plays a critical role in determining responsiveness and scalability.
ClickHouse® is particularly well suited for dashboard workloads because of its:
- Columnar storage architecture
- High compression rates
- Fast aggregation capabilities
- Efficient handling of large datasets
- Support for Materialized Views and pre-aggregation
These characteristics allow dashboards to remain responsive even when working with millions or billions of rows.
Why Apache Superset?
Apache Superset is an open-source Business Intelligence platform designed for analytical workloads.
Unlike traditional monitoring-focused tools, Superset provides a SQL-first approach that makes it well suited for OLAP databases such as ClickHouse®.
Some key advantages include:
- Rich visualization library
- Dashboard creation and sharing
- SQL Lab for query development
- Interactive filtering
- Dataset management
- Support for numerous database backends
For data teams already working with SQL, Superset offers a familiar workflow while still providing powerful visualization capabilities.
Apache Superset vs Grafana
Both Apache Superset and Grafana are popular visualization platforms, but they are designed for different use cases.
Apache Superset
- Designed for analytical workloads
- Strong SQL-first workflow
- Rich dashboarding capabilities
- Flexible data exploration
- Ideal for OLAP databases
Grafana
- Primarily focused on observability
- Excellent for metrics and monitoring
- Strong support for time-series data
- Popular for infrastructure dashboards
- Best suited for operational monitoring
For analytics workloads powered by ClickHouse®, Apache Superset often provides greater flexibility for ad-hoc analysis and dashboard development.
Why ClickHouse® and Apache Superset Work Well Together
ClickHouse® and Superset complement each other in a modern analytics architecture.
ClickHouse® focuses on:
- Data storage
- Query execution
- Aggregation
- Performance optimization
Apache Superset focuses on:
- Visualization
- Exploration
- Dashboard creation
- User interaction
This separation of responsibilities allows each tool to focus on what it does best.
The result is an analytics stack capable of handling large volumes of data while providing an intuitive experience for analysts and business users.
Architecture
The overall architecture follows a straightforward flow:
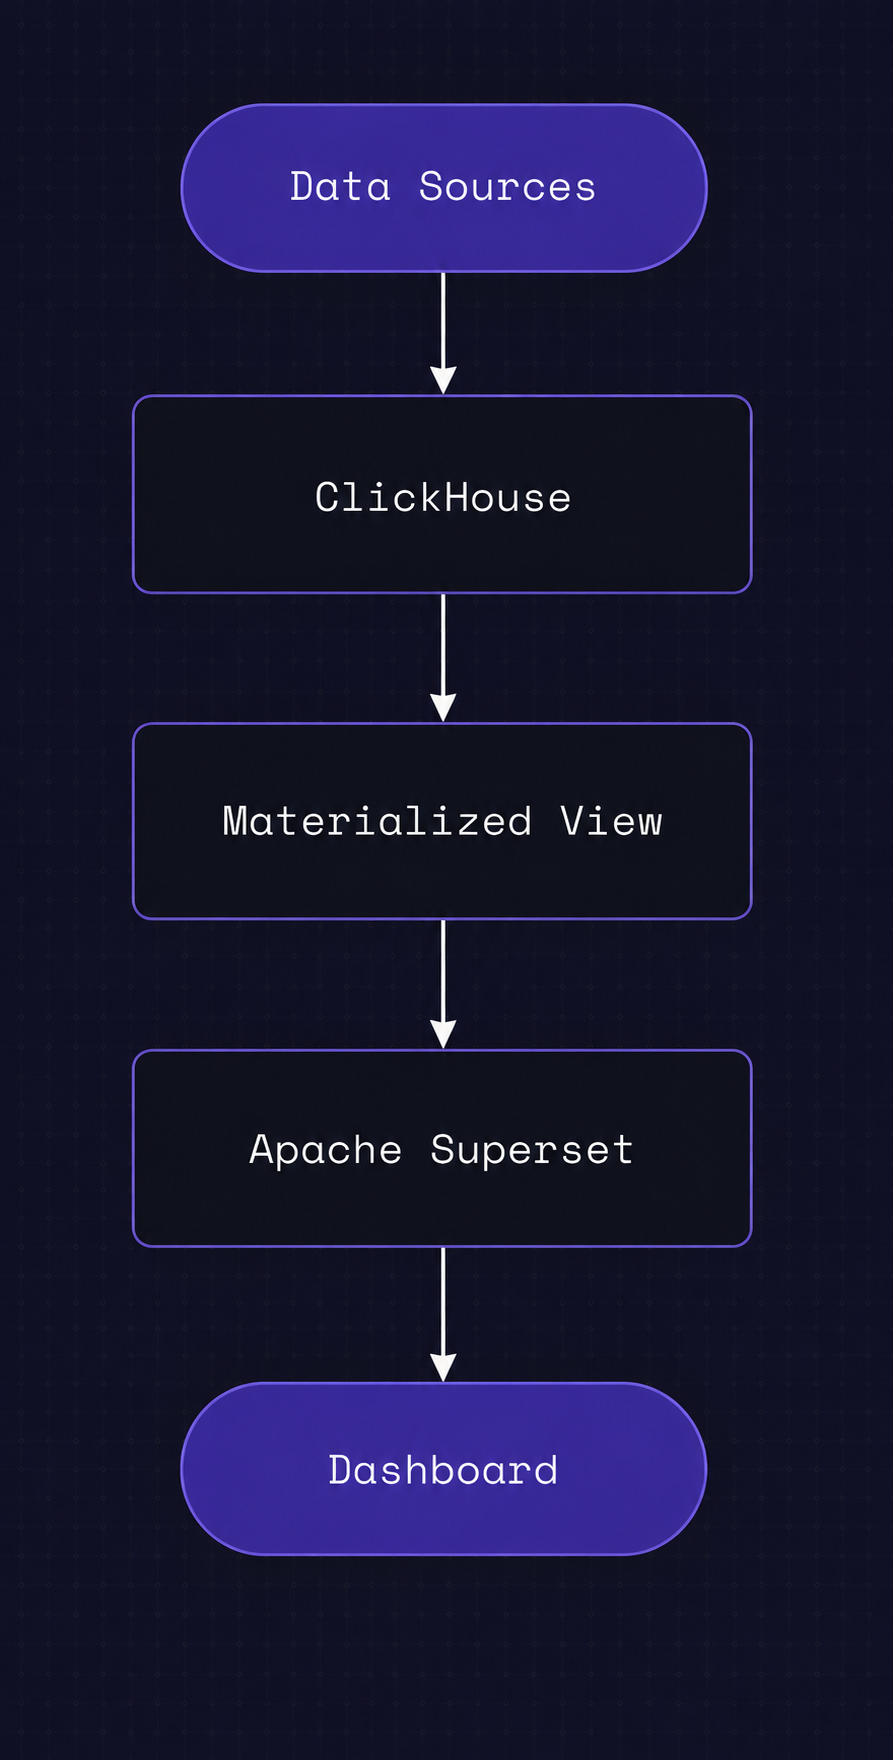
Raw data is stored in ClickHouse® tables. Materialized Views are used to pre-aggregate or transform data, reducing the amount of work required during query execution.
Apache Superset connects directly to ClickHouse® and queries either the raw tables or the optimized views to power dashboards and visualizations.
This approach keeps heavy computation inside ClickHouse®, allowing Superset to focus solely on presentation and exploration.
Dataset Design
For this implementation, a synthetic events dataset was created within ClickHouse®.
The objective was not to simulate a production-scale environment, but rather to:
- Validate the integration between ClickHouse® and Superset
- Build dashboards
- Explore query behavior
- Compare different data modeling approaches
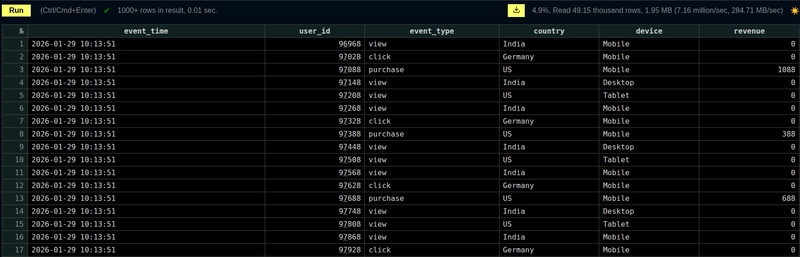
Even with a relatively small dataset, the setup provides valuable insight into how analytical workflows operate in practice.
Connecting Apache Superset to ClickHouse®
Once ClickHouse® is available, Superset can connect using the ClickHouse® driver.
A typical connection string looks like:
clickhousedb://default:password@clickhouse:8123/defaultAfter the connection is established:
- Register the database
- Create datasets
- Build charts
- Assemble dashboards
- Configure filters and interactions
From this point onward, Superset acts primarily as a visualization layer while ClickHouse® remains responsible for query execution.
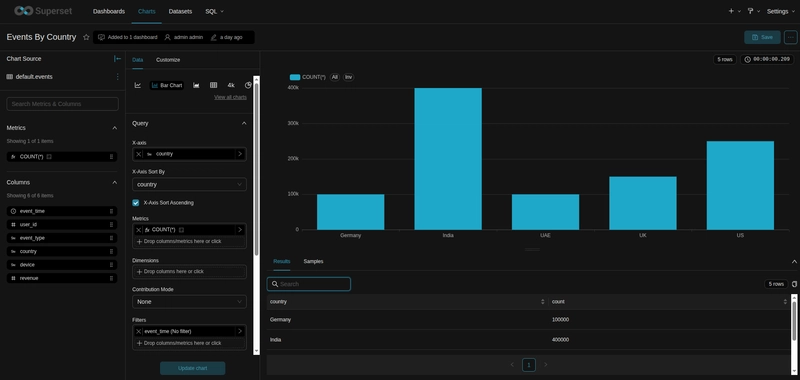
Building the Dashboard
After creating datasets, visualizations can be built directly from ClickHouse® tables.
The process generally involves:
- Selecting a dataset
- Defining metrics
- Applying filters
- Choosing visualization types
- Creating dashboard layouts
Apache Superset supports a wide variety of chart types including:
- Time-series charts
- Bar charts
- Pie charts
- Tables
- KPI cards
- Heatmaps
- Geographic visualizations
Once individual charts are created, they can be combined into interactive dashboards.
/home/hussain/quantrail-website/website/public/blog/images/a-s-2.webp
The resulting dashboard provides a consolidated view of the data while still allowing users to drill into specific metrics.
Raw Tables vs Materialized Views
One important question when building dashboards is whether query optimization matters for smaller datasets.
To explore this, the same analysis was performed against:
- A raw events table
- A Materialized View containing pre-aggregated data
Results
In this test environment:
- Raw table query: approximately 281 ms
- Materialized View query: approximately 222 ms
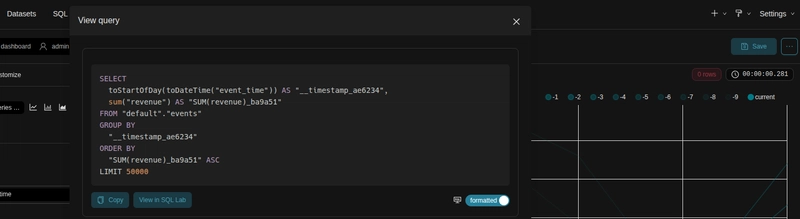
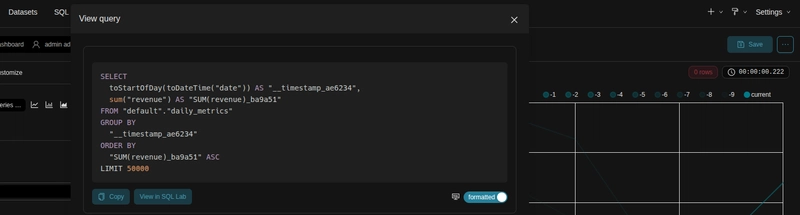
The difference is not dramatic, but it demonstrates an important concept.
Even at small scale, pre-aggregation can reduce query execution time.
As datasets grow, these improvements become increasingly significant.
Why Materialized Views Improve Dashboard Performance
Materialized Views are one of the most powerful optimization techniques available in ClickHouse®.
Rather than repeatedly computing the same aggregations, results can be calculated during data ingestion and stored for later use.
Benefits include:
- Reduced data scanning
- Faster dashboard queries
- Lower CPU utilization
- Simpler query logic
- More predictable performance
For dashboard workloads that repeatedly execute similar aggregations, Materialized Views often provide substantial performance gains.
If you're interested in optimizing ClickHouse® table design, you may also find our guide on choosing a primary key in ClickHouse® useful.
Challenges Encountered
While the overall setup process is relatively straightforward, a few issues were encountered during deployment.
Driver Not Detected by Superset
Error:
Could not load database driver: ClickHouseConnectEngineSpecRoot Cause
Superset runs inside its own Python virtual environment:
/app/.venvInstalling packages with the system Python does not make them available to Superset.
Resolution
/app/.venv/bin/python -m ensurepip
/app/.venv/bin/python -m pip install clickhouse-connect
ClickHouse® Not Visible in Database List
In some environments, ClickHouse® may not appear automatically in the database selection interface.
Resolution
Use a manual connection string:
clickhousedb://default:password@clickhouse:8123/defaultAuthentication Issues
Authentication errors may occur when existing Docker volumes retain outdated credentials.
Resolution
Remove the affected volumes and recreate the containers.
SQLite Migration Errors
Error:
table ab_permission already existsResolution
Allow Superset to initialize its metadata database from a clean state by rebuilding the environment.
Key Takeaways
Several important lessons emerged from this implementation:
- Data modeling has a direct impact on dashboard performance.
- Materialized Views help reduce query execution costs.
- Apache Superset relies heavily on the efficiency of the underlying database.
- Docker-based deployments can introduce environment-specific challenges.
- Understanding application dependencies and virtual environments is essential for troubleshooting.
Perhaps the most important takeaway is that dashboard performance is influenced far more by data architecture than by visualization tooling.
Conclusion
Building dashboards with ClickHouse® and Apache Superset provides an effective foundation for modern analytics workloads.
ClickHouse® delivers the performance required for large-scale analytical processing, while Apache Superset offers a flexible and user-friendly interface for exploration and visualization.
Even with a relatively small dataset, experimenting with Materialized Views and different query strategies demonstrates how architectural decisions can affect performance.
As data volumes increase, thoughtful data modeling, pre-aggregation, and query optimization become increasingly important for maintaining responsive and scalable dashboards.